Since announcing Core Web Vitals update rollout in May 2021, Google is making it easier for website owners to identify & measure its parameters to optimize their web pages’ experience.
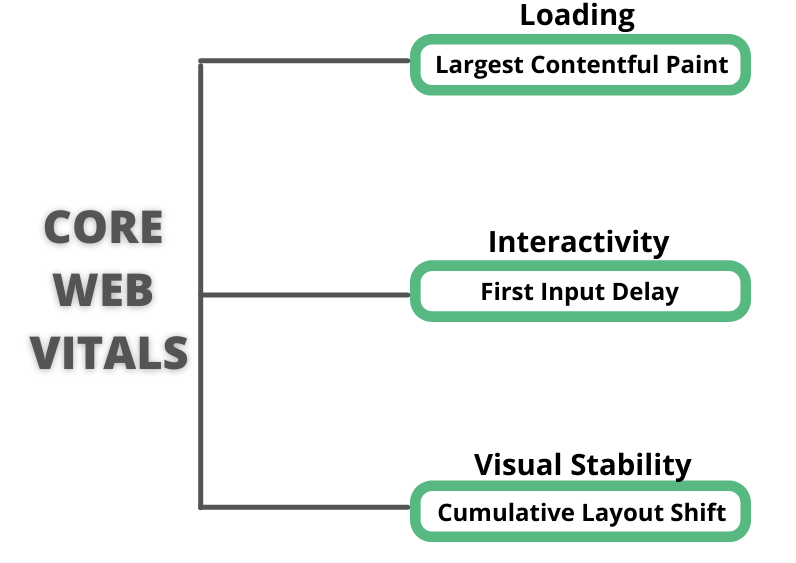
Now that search result rankings will be majorly impacted by the user’s experience, the three metrics to measure Core Web Vitals have become the key to optimize websites, namely:
- Loading time/Speed (measured in LCP – Largest Contentful Paint)
- Interactivity/Responsiveness (measured in FID – First Input Delay)
- Visual stability of a page (measured in CLS – Cumulative Layout Shift)
The ideal measurement KPIs are as follows:

Initially, one could only measure Core Web Vitals using Chrome UX report.
But with Google’s confirmation of Core Web Vitals becoming ranking signals, the company is expanding measuring capabilities to its other existing tools.
Table of Contents
The Core Web Vitals Measurement Tools
You need not have an extensive technical knowledge to identify gaps in your web pages’ experience. These tools do it for you. You just need to run your URLs through them and you will have set of identified problems. Simple!
Here are 5 easy ways for you to measure your website’s Core Web Vitals:
- Search Console
- PageSpeed Insights
- Lighthouse
- Chrome UX Report
- Web Vitals Extension
Search Console
You can access Core Web Vitals report using your search console account. Just login, go to enhancements sections, and click on Core Web Vitals.
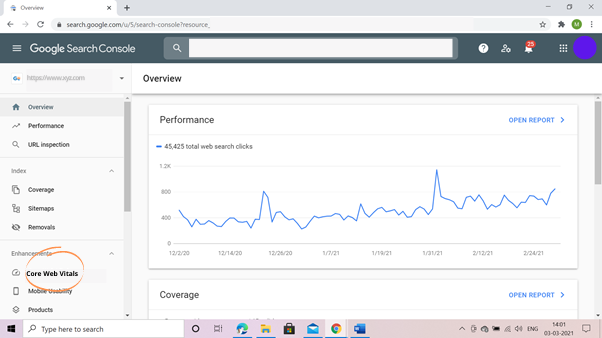
This helps site owners to audit entire site page wise for Core Web Vitals gaps and fix them. The pages in need of attention are flagged off in this report.
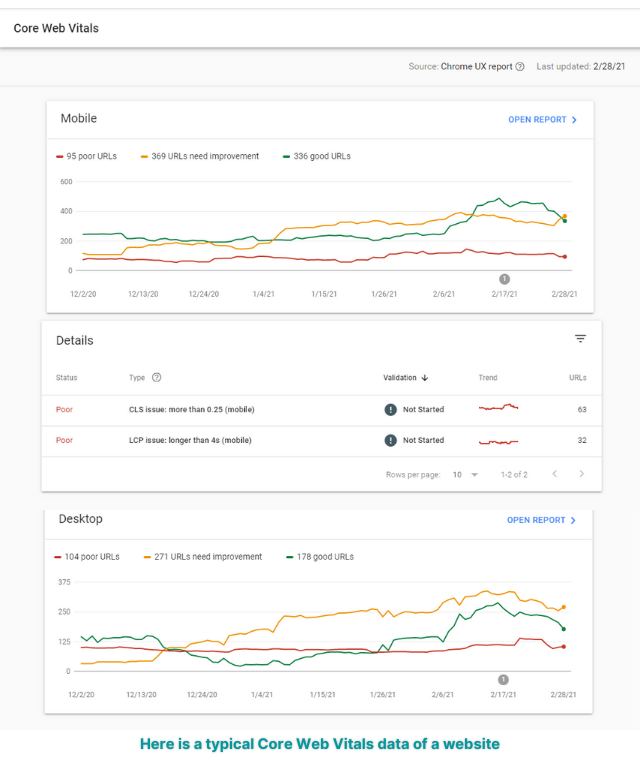
The search console report on Core Web Vitals gives a detailed understanding of the LCP, CLS & FID issues with the pages.


PageSpeed Insights
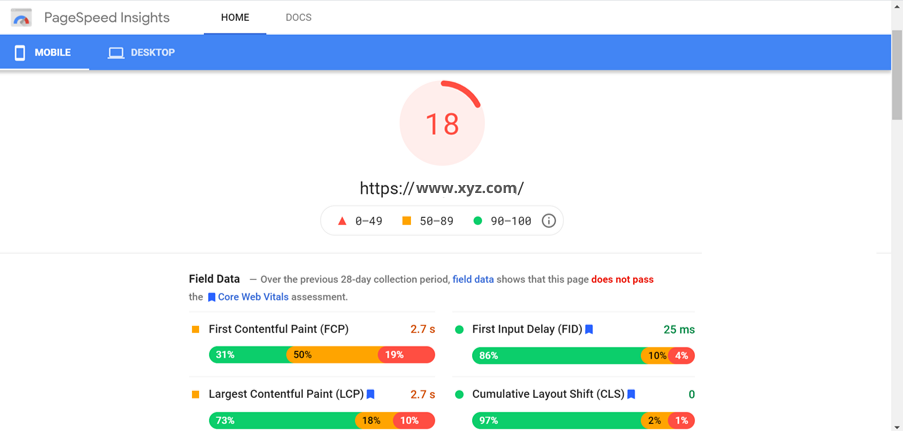
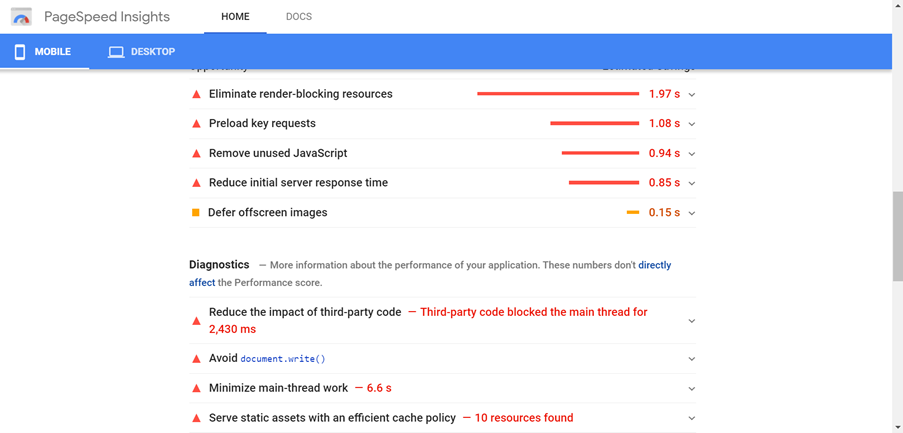
Google has upgraded PageSpeed Insights with Lighthouse 6.0. It is now enabled to measure Core Web Vitals, both in lab and field sections.
It reports the desktop & mobile performance of a page along with recommendations for improvements.
Lighthouse 6.0
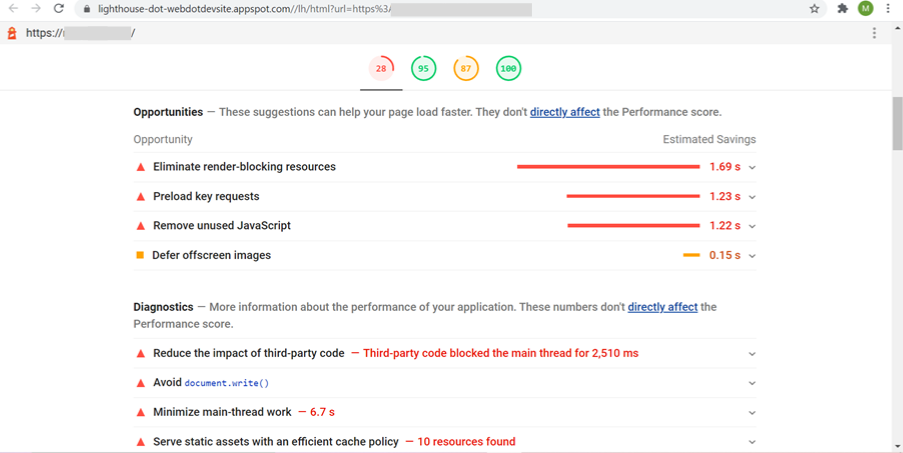
Lighthouse 6.0 comes with added new metrics, audits and a newly composed performance score metrics.
The two new metrics added are
- Largest Contentful Paint (LCP)
- Cumulative Layout Shift (CLS)
Total Blocking Time (TBT), the third metric correlates with First Input Delay (FID), yet another Core Web Vitals metric.
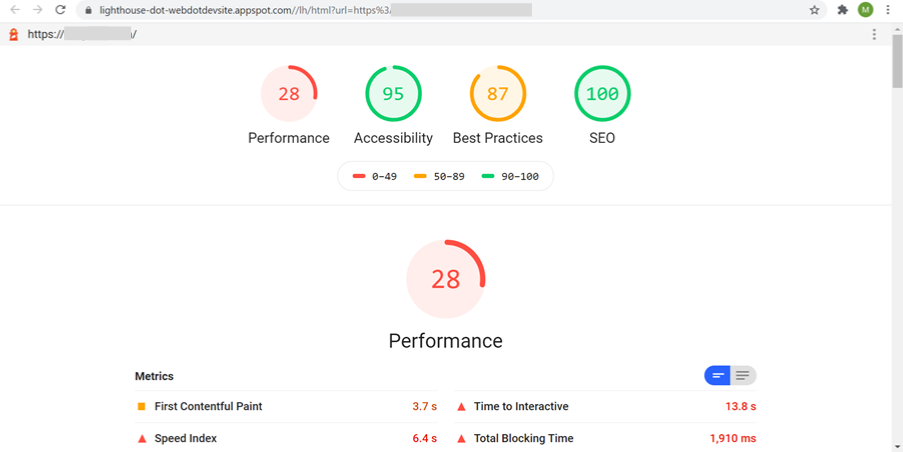
The reports are automatically executed once a day and their results are saved.
You can install it as a chrome extension from chrome web store. Once activated, the lighthouse icon appears in the toolbar. The webpage that is open in the chrome window can be assessed for its performance directly by clicking on the icon.
Chrome UX Report
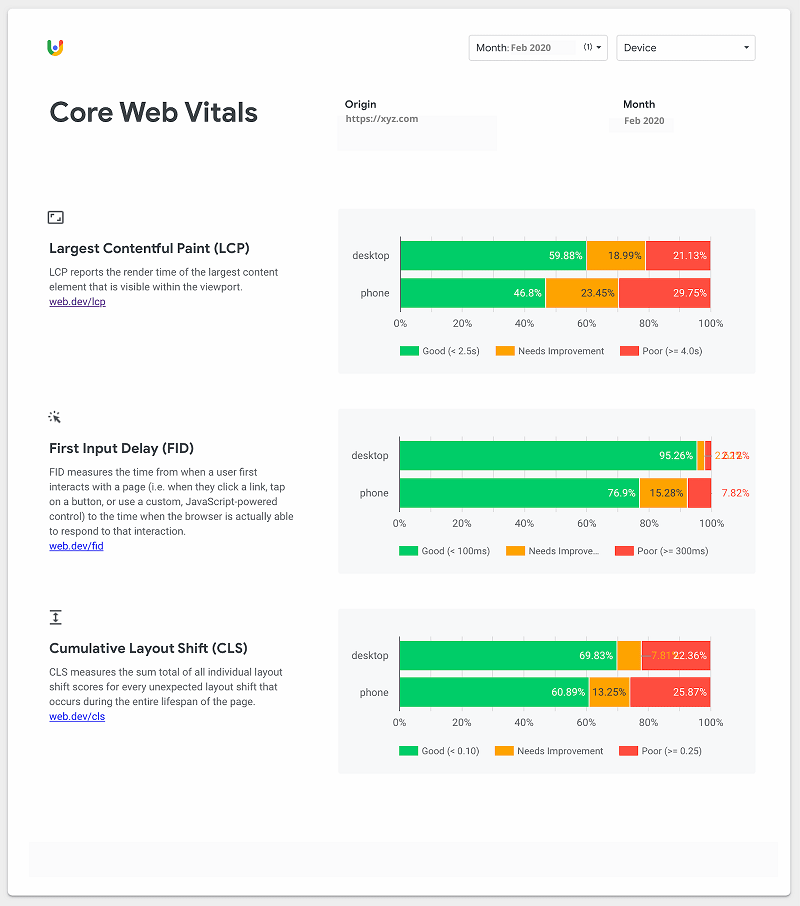
A Chrome UX Report, also knows as CrUX provides user experience metrics of how Chrome users experience popular destinations on the web in real world.
It measures field versions or experience on millions of websites. The CrUX delivers user experience data on how the real users experience websites around key metrics.
While the CrUX data is also used via PageSpeed Insights at URL levels, another way to access Chrome UX Report is via the CrUX Dashboard on Data Studio.
Web Vitals Extension
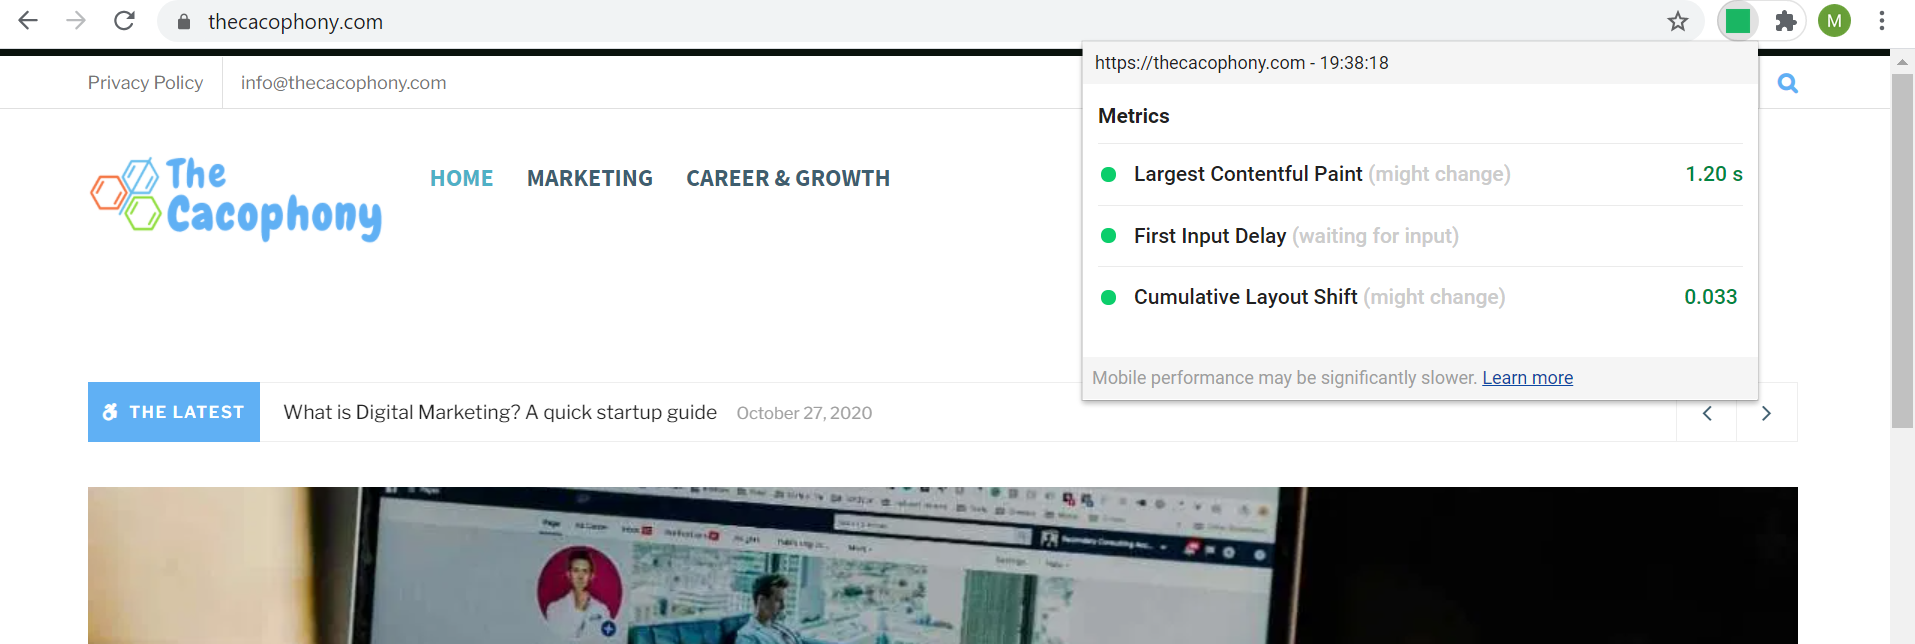
You can download Web Vitals Extension from Chrome Web Store. Install it on your Chrome browser and start measuring the three critical Google Core Web Vitals in real time while browsing.
It provides live data on all three core web vitals.
Conclusion
With Google Core Web Vitals update being rolled out in May 2021, maintaining experience of your web pages has become more important than ever. These are five of the easiest ways you can measure your website’s Core Web Vitals, without much to do with your technical knowledge. Come on! Start analyzing your web pages and continue with your consistent advantage over your competitors on Google SERPs.

